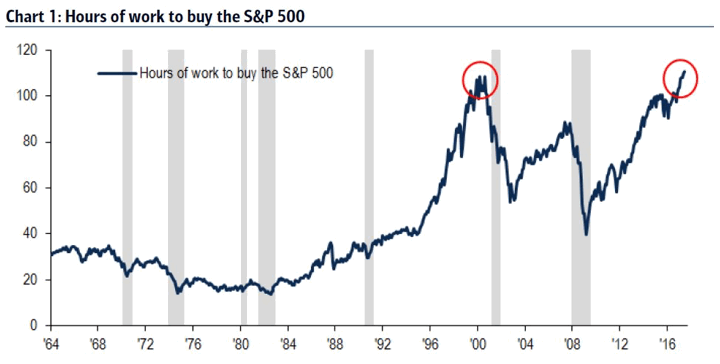
Sky-high stock valuations are a concern for everyone owning stock in today’s market. But how high is too high. The above chart gives one an excellent perspective of what high stock valuation means for the average investor. It depicts how many hours the average worker must work to buy a notional share of the S&P 500.
Valuations measured by this methodology soared in the late 1990s, reaching its zenith in the dot.com bubble and crashing with the stock market.
Valuations climbed again into the 2008 crash but were not able to reach the 1990s level until now.
Two occurrences could bring the line down to a more normal level. Either the wages need to rise appreciably higher or the stock needs to drop.
The breadth of the market at these valuations is also worrisome. While the stock indices have moved steadily higher since November 2016; the number of stocks trading above their 200-day moving average has moved sharply lower since February 2017. In February over 72% of S&P 500 stocks were trading over their 200-day moving average. Today, just over 50% of the stocks would be said to be still in a long- term bull trend. This would indicate that to be successful in the stock market right now, investors need to be not only good market timers but also good stock pickers.
For stock valuations to stay strong it depends on strong forward revenues. That depends on the consumers ability and willingness to spend. Core Retail Sales showed an improvement in July to +3.6%, better than expectation but still far below the 5%+ growth rates we have seen in past two recoveries.
So, what’s the problem? It is hard to spend when you are faced with high and rising debts. Total consumer debt is near the levels it was at the beginning of the last recession according to the New York Federal Reserve. Mortgage debt accounts for the bulk of all consumer debt (68%). While that level is rising it has still not reached 2008 historic highs. But student loan debt, auto loans and credit card debt now exceeds $1 trillion each. Rents, vehicle expenses and healthcare (high deductibles) are not included in the debt balance figure but must be paid for. The consumer may be stretched about as far as he can go. The fact that the savings rate is the lowest since 2008 would indicate that.
At the end of the day we are still in a bull market in stocks and they continue to make new highs without so much as a 5% sell off. At Worldwide Capital Strategies, we feel it is prudent to hope for the best but plan for the worst. A 10% to 20% allocation to managed futures could go a long way towards risk mitigation in the coming months.
Tom Reavis
President
Worldwide Capital Strategies
The content of this article is based upon the research and opinions of Tom Reavis.
